
5 min read
In 2020, the pandemic presented many small business owners with a crash course on financial metrics and why they matter. You may be one. I imagine you’ve owned your business for a few years or more, endured some ups and downs but overall enjoyed steady growth, watched your cash flow and know your bottom line. Why was selecting, applying for, and tracking small business relief funds such a challenge? Let’s start by taking a close look at the factors creating the challenge and how to prepare your business with metrics that matter for the future.
Pandemic relief programs
For most small businesses, there were two major relief programs available to help during the Covid-19 pandemic: The Economic Injury Disaster Loan (EIDL) and the Paycheck Protection Program (PPP). Although it was possible to apply for both programs, the application process was different (and cumbersome), each program had different eligibility criteria, different documentation requirements, different federal funding levels, and each has worked best to help distinct types of businesses.
Many small businesses (especially the self-employed, or those without a CFO or HR manager on staff) were unsure how to calculate or document their maximum loan amount based on the required financial metrics — or by the time the calculations had been made, the programs had run out of money. Particularly troublesome:
- Average monthly payroll cost for allowable wages and benefits
- How to calculate the maximum loan amount if you were an independent contractor or self-employed
- The level of full-time equivalent employees that needed to be maintained or restored.
- How to calculate and document changes to net profit due to the pandemic
While it is easy to recognize the importance of monitoring cash flow for your business (no money in the bank to pay the bills) it can be harder to see the importance of other key financial metrics as years go by after startup. An additional nine metrics are key to financial literacy for the owner of a small business, and proved helpful to those applying for pandemic relief in 2020.
Nine Key Financial Metrics
- Business Model
- Sector or Industry
- Employee Headcount
- Employee Turnover
- Revenue per FTE
- Total Annual Benefits Cost
- Direct Labor per hour (average)
- Cost of Goods Sold (or cost per client/customer)
- Gross Margin
Business Model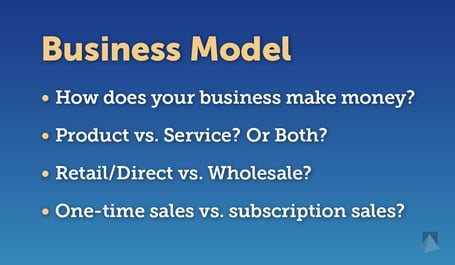
Think through the answers to these questions and consider the implications.
- How does your business make money?
- Product vs. Service? Or Both?
- Retail/Direct vs. Wholesale?
- One-time sales vs. subscription sales?
It is impossible to pivot to another business model unless you have a solid grasp of where you are starting from, and the financial similarities and differences of each business model.
Sector or Industry
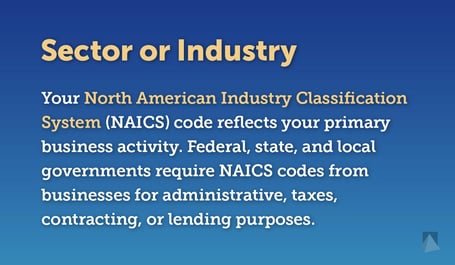
Your North American Industry Classification System (NAICS) code reflects the sector or industry of your primary business activity (revenue producing activity). Federal, state, and local governments require NAICS codes from businesses for administrative, taxes, contracting, or lending purposes. An easy number to look up, the NAICS code is especially useful when you do not have historical data or benchmarks for your business.
- What can you learn from what other businesses in your classification are doing?
(For example, if you operate a full-service restaurant, are others applying for a PPP loan? If not, why? Did they determine their payroll costs were less than the 75 percent required for forgiveness in the original CARES Act?) - If your gross margin or net profit are not ideal, what is the range for others in your industry? What are their ratios and percentages?
- If the guidelines for a relief program (or later, an economic incentive program) do not work for you, collaborating with others in your sector to explain why to policy makers amplifies your voice and can effect change.
Employee Headcount
Employee headcount vs. full-time equivalent (FTE) became a key factor in qualifying for forgiveness of a PPP loan. Here are the numbers many small business owners struggled with.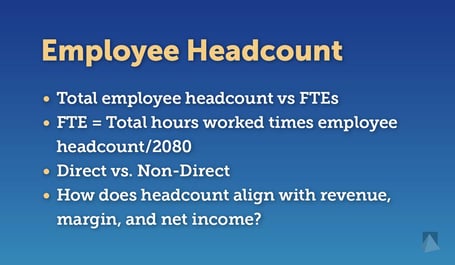
- Total employee headcount vs FTEs
(When an employer has a 40-hour workweek, employees who are scheduled to work 40 hours per week are 1.0 FTEs. Employees scheduled to work 20 hours per week are 0.5 FTEs.) - FTE = Total hours worked times employee headcount/2080
(The standard calculation for employee work hours per year is 2080: calculated by multiplying 52 weeks by 40 hours per week.) - Direct (Production) vs. Non-Direct (Everyone else)
- How does headcount align with revenue, margin, and net income?
Remember that headcount is often slower to adjust than revenue. That was certainly the case for restaurants and shops suddenly forced to close by government emergency order during the Covid-19 pandemic.
Employee Turnover
- Trailing 12 months
- Total number of terminations
(Average number of employees per month x 100) - Voluntary vs. Involuntary
- How do you compare to your industry?
- What insights does your turnover provide about your company culture?
Revenue per FTE
Employee turnover is costly in any industry and can quickly affect profit as well as product or service quality. Particularly for seasonal businesses, documenting that you have returned to previous employment levels can be a challenge without historical turnover records.
Revenue per full-time equivalent employee is one of the most valuable metrics to evaluate options for increasing productivity and profitability. This metric varies significantly by sector and industry.
- Measures how much annual revenue your company produces per Full-Time Employee
- Annual/FTEs
- Annualized = Last month revenue x 12
- Over time, is your company more or less productive with each FTE?
- Are there specific sizes that are more optimal than others?
(For example, for every 15 employees do you need to add the cost of a supervisor without adding an equivalent increase in revenue potential?)
Total Annual Benefits Cost
- Total annual cost of all employee benefits
(Medical + Dental + Vision + LTD/STD/AD&D + Workers Comp + 401k Contributions.) - Divide by total headcount to calculate average annual cost per employee
- Divide by total hours worked to give hourly “burden”
- Remove/separately calculate an executive team or owners
- Useful to calculate the average annual benefits cost per FTE
- Used to determine when necessary to hire new employees
- Shows trend of benefits cost when compared Year-to-Year
Relief programs allowed and disallowed specific benefits, for example, workers comp was not eligible to be included in total payroll costs for the PPP.
Direct Labor per hour (average)
Without a good handle on your direct labor cost, you do not have the foundation for calculating how to set your price.
- Total wages of all direct labor employees/Total hours worked
(Remember to remove overtime.) - Helps you or your CFO decide if the company is charging enough for its product/service to make your targeted gross margin
- Helps you or HR/Manufacturing know what range of hourly rates you can offer and still hit gross margin targets
- Fully burdened rate adds in benefit costs to show the true hourly cost of a production or direct service employee
Cost of Goods Sold (or cost per client/customer)
- How much does it cost to produce one product or service for my customer?
- COGS = Materials + Packaging + Labor + Overhead
- Cost of Service = Primarily Labor
- Helps determine the price you need to charge
- What hidden costs are there to produce?
Gross Margin
 You hear about net profit all the time, but it is easy to forget that net figures start with gross numbers. Your bottom line, or net profit, begins at the top.
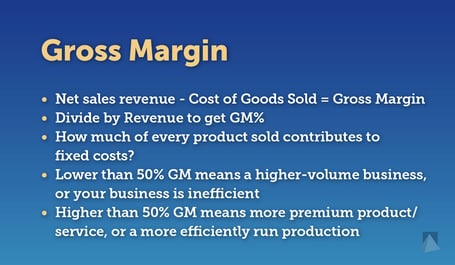
- Net sales revenue - Cost of Goods Sold = Gross Margin
- Divide by Revenue to get GM%
(Total Revenue – Cost of Goods Sold)/Total Revenue x 100) - How much of every product (or billable hour) sold contributes to fixed costs?
- Lower than 50% GM means a higher-volume business, or your business is inefficient
- Higher than 50% GM means more premium product/service, or a more efficiently run production
The financial turmoil wrought by the coronavirus pandemic did not change the basics for small business — it simply highlighted the need to be on top of key financial metrics. Amid uncertainty, knowing your business numbers opens possibilities and helps you to be better prepared for the future.
Resources
US Census Bureau: North American Industry Classification System (NAICS) code
SBA: Glossary of Business Financial Terms
NYSSCPA: Dictionary of Accounting Terms
SBA: Economic Injury Disaster Loans
SBA: Paycheck Protection Program
-------------
Heidi Clute, CFP® of Clute Wealth Management in South Burlington, VT and Plattsburgh, NY, an independent firm that provides strategic financial and investment planning for individuals and small businesses in the Champlain Valley region of New York and Vermont. Content in this material is for general information only and not intended to provide specific advice or recommendations for any individual.